Debugging Ionic 5 apps using Chrome and Safari developers tools

Nowadays creating an application, web or mobile, which solves real life problems looks like a regular thing. But creating that application takes a lot of steps like creating business logic, UI components, testing and much more. One the most important parts is debugging an application, the technology/language doesn’t matter, debugging is involved in every case.
What is debugging ?
Debugging is the process of detecting and removal of existing and potential errors (also called as ‘bugs’) in a software code that can cause it to behave unexpectedly or crash. To prevent incorrect operation of a software or system, debugging is used to find and resolve bugs or defects. These bugs can be visual or logic related, just user experience related or business logic related critical ones, front-end or back-end related etc.
Users might give your app a lesser star rating for just some UI / UX bugs, which you can fix in next version, but a critical logic related bug (imagine something related to a payment system) can in fact render your app rejected from app stores, or worse, can get you sued for financial malpractice.
Hence debugging plays one of the most important role in development of any software or application. With debugging, we can find bugs which can potentially lead to an unintended consequence for the developers or the company.
Different tools for debugging mobile apps
Generally speaking mobile apps can be divided in the following categories
- iOS Native Apps
- Android Native Apps
- Hybrid apps based on webviews — Ionic, Cordova, Phonegap etc.
iOS native apps can be debugged only in XCode, the Apple software which is also used for developing the iOS apps in Swift or Obj C. Similarly Android apps can be debugged with Android Studio which, again, is the software used for developing Android apps in Java / Kotlin.
Ionic apps, as you might know, are based on web-views. These are also called hybrid apps, and they work both on Android and iOS. The code is written in HTML / CSS (UI) and Javascript (logic). The code then translates itself into a packaged application that runs in iOS and Android.
Android Studio and Xcode are both capable of reading Ionic’s packaged application. But the latest versions of Ionic do not leave a human readable JS code in the packaged app (except for plugins’ code), for obvious security reasons i.e. the end users should not be able to decompile your app and steal the code. As a result you can’t debug the apps 100% in Android Studio or iOS. For debugging the core logic of the app, your development tool is your best friend, and that is — the browser itself !
Debugging an Ionic 5 application
Debugging in Ionic 5 application is pretty easy than in any other technology. Debugging process is backed by the browser’s developers tool — each browser Chrome, Mozilla, Safari has its own. We can debug applications and can also see the logs in the developers window.
Following is the list of major tools in browser’s developer tools —
- Inspect HTML / CSS of UI component, edit in real-time
- Check console logs — Gives you the values of variables, and an idea of sequence of operations at the app runtime
- Check API execution and responses
- Check local storage, cookies etc.
- Check performance of the app
As we know Ionic can create both web and mobile applications using same code, the debugging for both can be done using same Browser’s developer tools. Let’s see how we can debug Ionic applications —
Developer tools components for Ionic application
To debug an Ionic web app is same as the debugging any normal JavaScript web application. You can simply use the inspect option by right clicking on any website element.
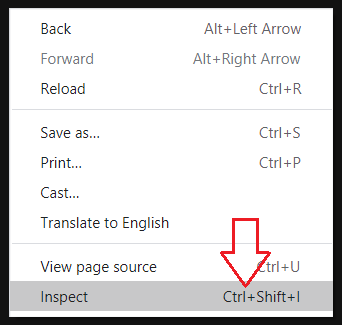
This will open up the developer console, where you can view every visual and logical aspect of the website.
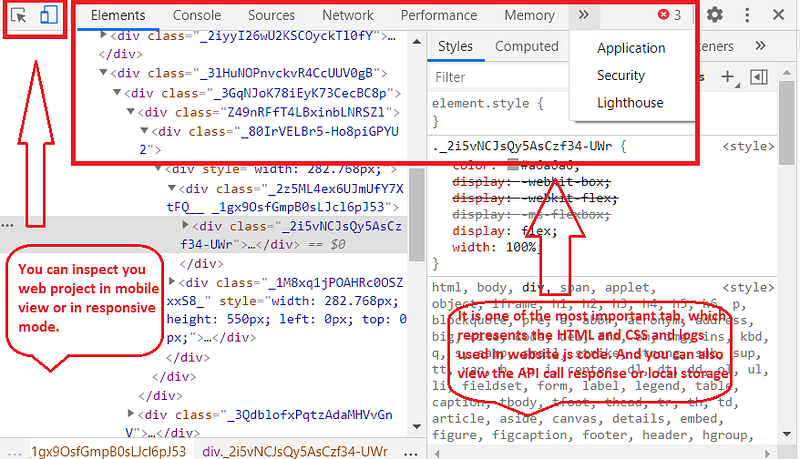
This is the magical developers console, we can view any information related to your web application whether it is viewing HTML, CSS or getting info about any API call with response and you can also get the local storage view using the developers console.
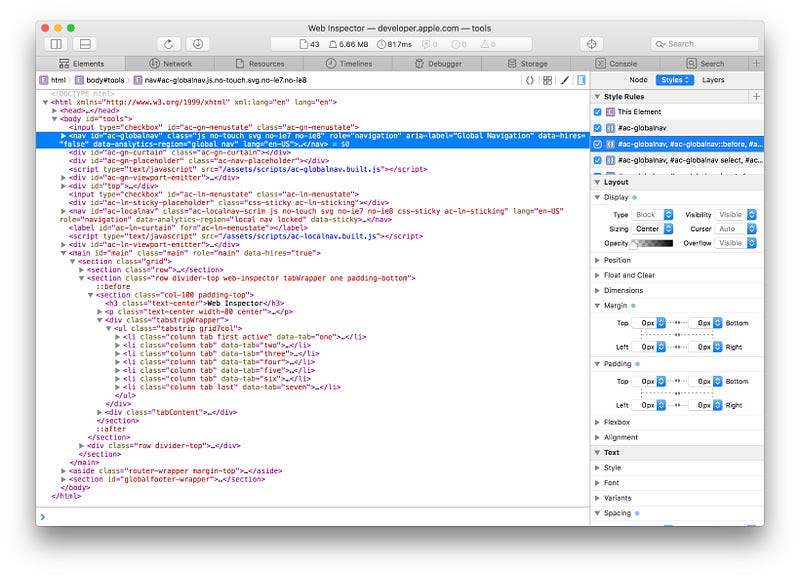
1. Elements
Elements tab gives you the real time view of the app, whether web or mobile. The elements tab shows you the UI elements, the HTML code or all elements and CSS (styling) of the elements in real-time. By real-time, I mean you can edit the HTML or CSS in this window, and see the real-time changes in the app UI on the left side. This is a powerful tool for UI developers.
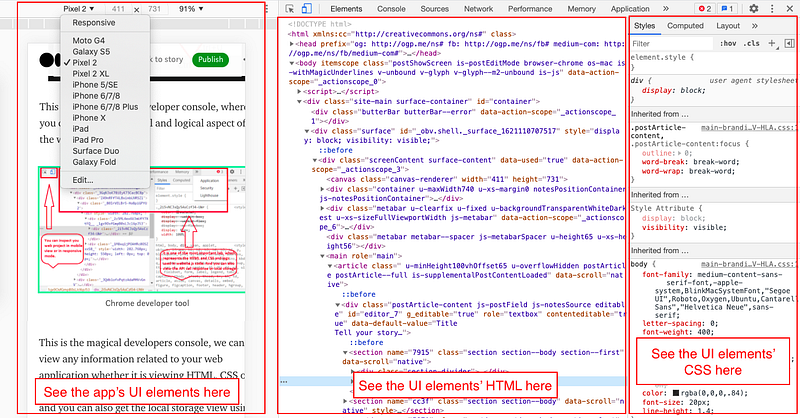
Another huge help is the Responsive Design Tool, which you see on the left in the above image. This allows you to see your app in various device sizes, be it in Large, Medium or Small sizes as per Bootstrap or any other web library, OR, as per different models of iOS and Android phones. You can select a size from the dropdown
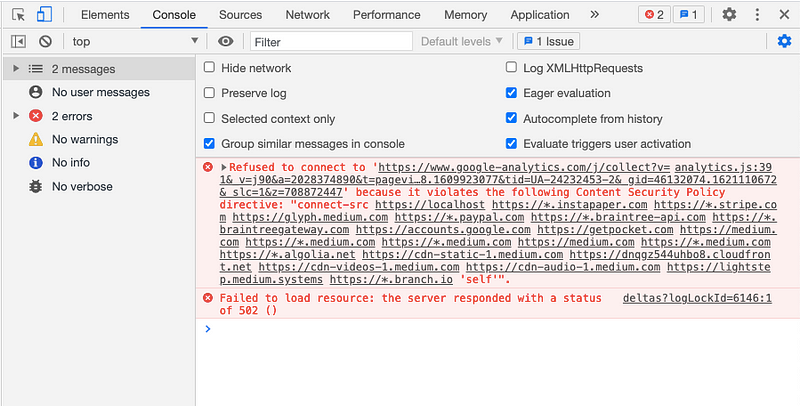
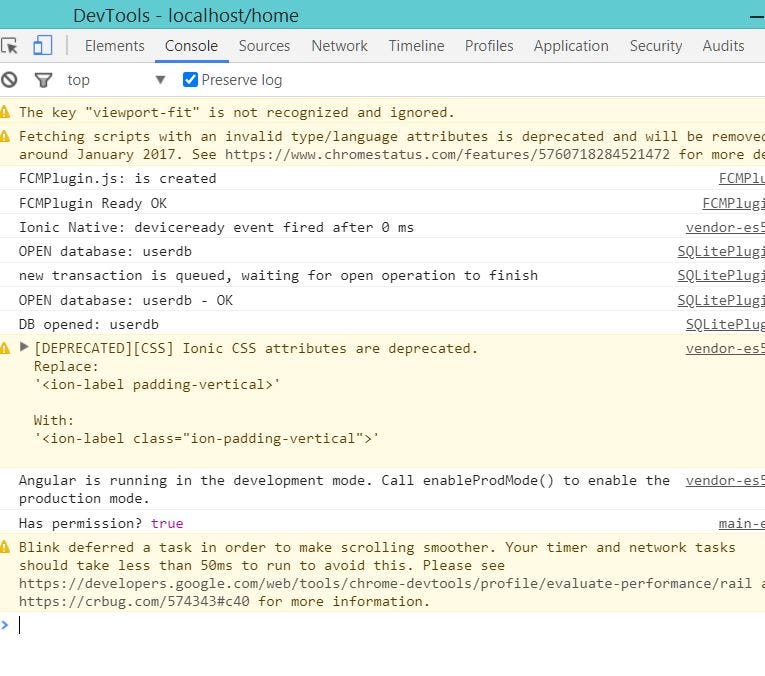
2. Console Logs
You can view your console logs and errors in Console tab, It is most used tab by developers as it makes thing easy to debug and to understand the flow of the logic.
When you print the value of any variable etc. the console log also gives you the file name and line number of the code, which helps you figure out what part of code is running in what sequence.
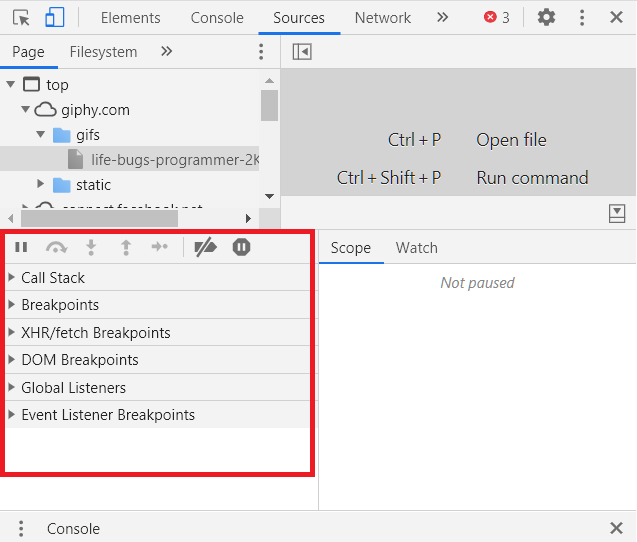
3. Sources — Viewing logical components of app
This tab is used to view the technical aspect of your website. In this tab, You can view stack calls (promise event stack), action listeners and DOM related information. This is mostly logic related stuff written in JS for Ionic apps.
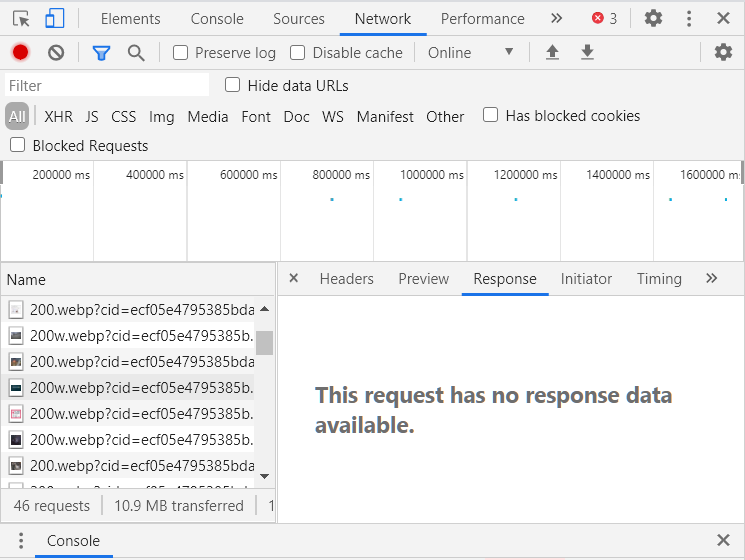
4. Network Tab
In this tab you can view your API calls, file loading with status and other related information. You can also see the responses returned by the API in this tab. This enables you to figure out the input / output of various APIs in a complex app, without having to print everything on the console.
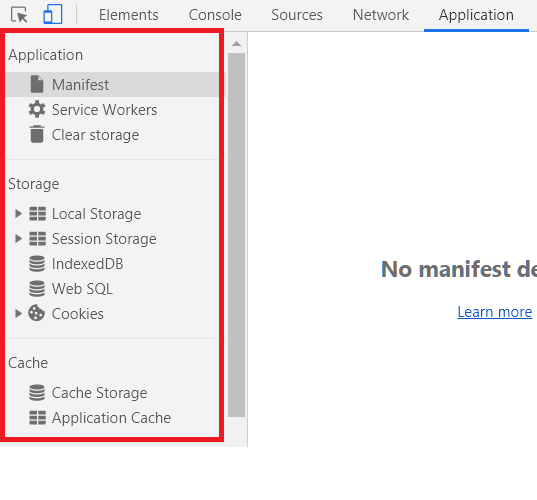
5. Application Tab
This tab can be used to view the local storage, session storage, cache storage or cookies used by the application. This helps us to debug the application when you are using the local storage. You can easily check what data your app is storing in these storages, you can edit the data or even remove it manually.
This tab also contains information about Service Workers, which are an important component of a progressive web app (PWA).
Ionic also uses client-side databases like Indexed DB or SQL for storing systematic data. These area little different from local storage or session storage in terms of the structuring and security of data. These database values can also be accessed from the Application tab.
Now we are done with options, using which we can debug our Ionic web application. These options will help the developers in debug app and deliver faster.
Debug Ionic Apps on mobile device
We have seen that Ionic is one of the best choices when you are trying to build a hybrid application for both Android and iOS. Ionic is very popular for its easy debugging and huge number of plugins.
Debugging Ionic apps in production mode
An interesting thing is that we can debug application in development mode as well as in production mode. Usually applications are difficult to be tested in production mode, but we can do that using Sentry with Ionic 5 application. Read more about it in Debugging Ionic apps using Sentry blog.
Debugging Ionic apps in development mode
To debug Ionic mobile application in development mode on your device, we want something called Google Chrome Inspect tools (or similar tools in other browsers), which helps us to do all of the things we saw earlier in this blog. To debug follow below steps :-
ANDROID
- First connect the USB cable to the device and then switch ON the USB debugging under the developer options in your android phone (OR you can use the Emulator)
- Run the below URL in goggle chrome
chrome://inspect/device#devices
- Select the app from the listed ones in Chrome Inspect Window. This will show up only when the app is open on the device or emulator.
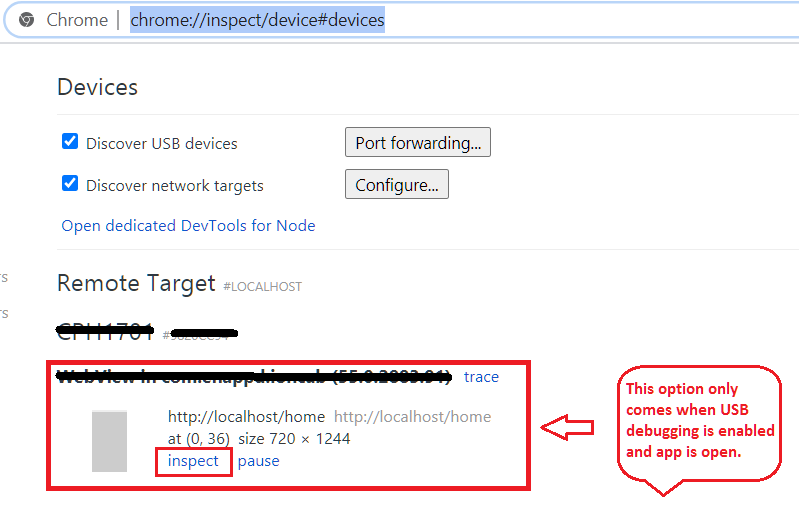
Clicking the ‘Inspect’ will open the developer tools window for this running app. This will show you all of the options i.e. elements, console logs, local storage, Network Information and more.
iOS
For iOS apps’ debugging,
- Connect your device with USB cable, or run the app on emulator (You need a Macbook or iMac for this)
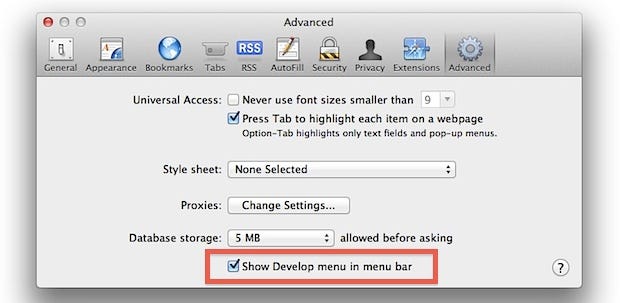
- Open Safari and make sure the developer options are ON from Preferences -> Advanced -> Show developmenu in Menu bar
- Select the device or emulator from Develop Tab and select the app running in development mode
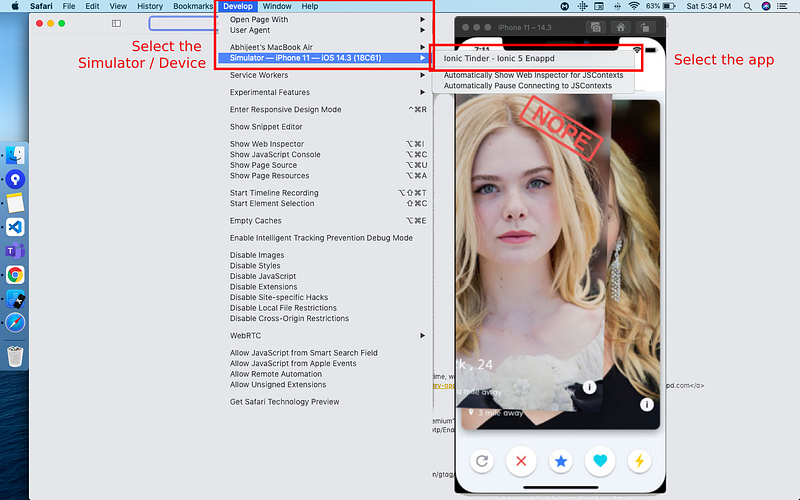
This will open up almost the same developer tools as Chrome, which we discussed earlier. Few of the tabs’ names are different here e.g. Sources in Chrome is Resources in Safari, Application in Chrome is Storage in Safari etc.
Now you are all set to debug the Ionic apps for both Android and iOS. All of the console.log and error can be seen in console tab of Chrome/Safari DevTools.
Conclusion
Now you have learnt how to use Chrome and Safari developers tool for app debugging, so you are all ready to hunt bugs in your application with 100% efficiency and accuracy.
Thank You…!!
Next Steps
If you liked this blog, you will also find the following Ionic blogs interesting and helpful. Feel free to ask any questions in the comment section
- Ionic Payment Gateways — Stripe | PayPal | Apple Pay | RazorPay
- Ionic Charts with — Google Charts| HighCharts | d3.js | Chart.js
- Ionic Social Logins — Facebook | Google | Twitter
- Ionic Authentications — Via Email | Anonymous
- Ionic Features — Geolocation | QR Code reader| Pedometer
- Media in Ionic — Audio | Video | Image Picker | Image Cropper
- Ionic Essentials — Native Storage | Translations | RTL
- Ionic messaging — Firebase Push | Reading SMS
- Ionic with Firebase — Basics | Hosting and DB | Cloud functions
Ionic React Full App with Capacitor
If you need a base to start your next Ionic 5 React Capacitor app, you can make your next awesome app using Ionic 5 React Full App in Capacitor
Ionic Capacitor Full App (Angular)
If you need a base to start your next Angular Capacitor app, you can make your next awesome app using Capacitor Full App

Ionic Full App (Angular and Cordova)
If you need a base to start your next Ionic 5 app, you can make your next awesome app using Ionic 5 Full App